
What you Need To Know and It’s Important
Hello auto repair shop owners and managers. My name is Josh Davis, Chief Revenue officer here at Mail shark.
If you are thinking about using direct mail or currently using direct mail to acquire and retain more customers for your auto repair shop, there is one very important report that is critical to the success of your direct mail campaigns, called a penetration report.
Penetration reports are the most important report you will use with direct mail marketing, because they leverage your shops customer data to help strategically select the best areas to target new customers. Sending your direct mail marketing to the wrong areas is the quickest way to kill your response rate and waste your precious marketing dollars.
However, over the years we continuously experience a lot of confusion from shop owners understanding the difference between penetration reports they have received from other direct mail companies in comparison to penetration reports run by Mail Shark. There is one specific difference that IS CRITICAL in understanding how to properly evaluate penetration report day.
With that said, my goal with this article is to bring transparency to the following:
- Provide a clear understanding as to the importance of utilizing penetration reports and how to use them properly.
- Provide you with a detailed explanation to the one key difference in the way Mail Shark runs our penetration reports, compared to how other companies run their reports. It is very important you understand the difference as I have seen first-hand how causes confusion.
First, to understand penetration reports, you must know what a carrier route is. A carrier route is simply a further breakdown of a zip code and happens to be route that a postal worker takes to deliver mail to your house or business every day.
Below on the left-hand side highlighted in all purple shows what the entire example zip code of 19610 looks like. The image on the right is the same example zip code of 19610. However, this image breaks out each individual carrier route into different highlighted colors to give you a better perspective as to what a carrier route can looks like.

The importance of a carrier routes is that when sending out direct mail for general auto repair shops, quick lube shops and tire dealers (Not Euro/Specialty Shops), it is almost always done by identifying specific carrier routes and targeting every residential address within those routes.
This is for two specific reasons:
• Targeting carrier routes allow you to get granular and strategically target specific areas without having to target an entire zip code. In most cases there are addresses that are closer to your shop that are in a neighboring zip code than in your own zip code, hence mailing an entire zip code doesn’t make sense.
In addition, it’s likely that there are some areas in your zip code that you may not want to target due to incomes levels or other demographics. When mailing by carrier route, you can pick and choose any carrier route you want to include or exclude in as many zip codes you choose, making this the best choice for general auto repair shops.
• Mailing by carrier route provides the lowest postage rate to target everyone in a specific area making it the most cost-effective solution for general auto repair shops.
What Do Penetration Reports Do?
Now that you understand what a carrier route is, a penetration report takes your current active customers and appends them back to the exact carrier routes that each of your customers live in.
Appending each customer back to the exact carrier route, gives us the ability to:
- Determine the distance that most customers are willing to travel to your shop. Once this perimeter is established, we can ensure to never target prospects beyond these points.
- Determine how many houses within each route that you have customers. This is where the “penetration comes from” as we take take the number of addresses in the route and divide it by how many houses you to determine the % of penetration into each route to gauge how well you have done acquiring customers in each route relative to other routes.
For example:
If there are 500 houses in a carrier route and you have 1 customer each in 50 of the houses, then you have a 10% (50 houses with customers/500 houses = 10%) penetration in that route.
With both these pieces of information, as state above we can begin to strategically help select the best carrier routes to target new customers in. Whether that be continuing to target routes you have the highest penetration of customers or targeting other routes with similar distance and or demographic makeup, to see if we can increase penetration in those routes.
As a bonus of this process, since we already have our client’s current customer database needed to run the penetration report, we can use that same customer data to suppress their shops current customers from their mailing, so they aren’t sending a new customer acquisition mailer to customers that are already actively coming to their shop, if they of course want them removed.
Now to The Key Difference In Reporting You MUST UNDERSTAND!
Now that you hopefully have a clear understanding of what a penetration report is and why they are so critical, it’s important to understand the key difference in how many companies run their penetration reports as compared to how we do things here at Mail Shark.
To illustrate this difference, let’s look at the example below:
The example below is how MOST direct mail companies analyze and calculate their penetration reports….
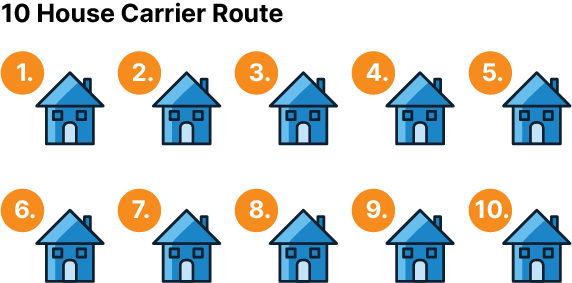
Let’s assume there was a carrier route with 10 houses just for this example. Of course, this would never happen as carrier routes have hundreds of addresses in them, but to illustrate the main point bear with me on this fictitious route has 10 houses in it.
Now let’s assume an auto repair shop has one customer each in 5 different houses.
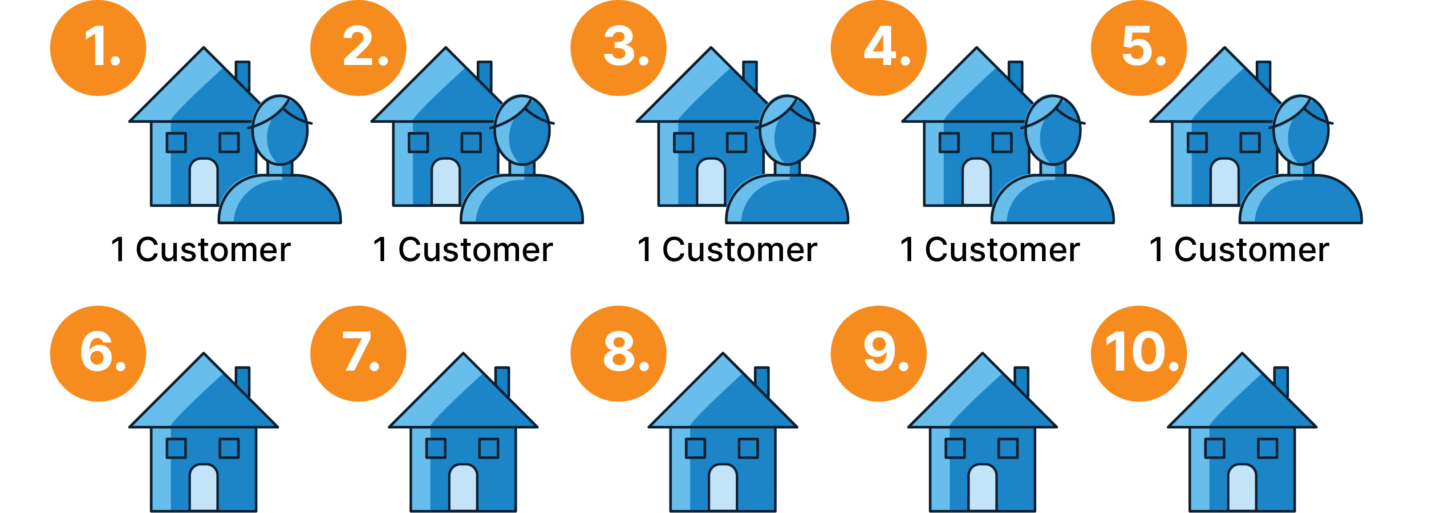
Based on a penetration report, this would mean that you have a 50% penetration in this carrier route.

This leaves 5 homes that you do not have a customer in that are potential targets.
Now let’s take the same example, 10 house carrier route and instead of one customer in each house, let’s assume that you have two customers in each of the same 5 different homes, which could be a husband and wife or parent and child.
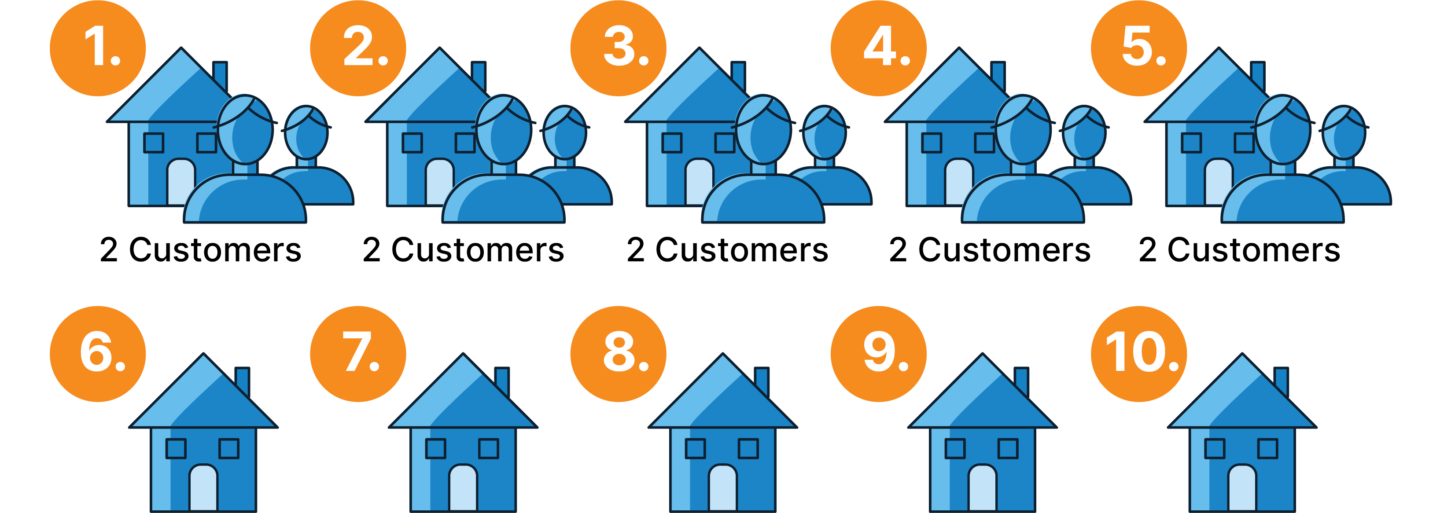
In this scenario there is a total of 10 customers in this carrier route which would impute a 100% penetration rate.

However, in this example there are still 5 houses that you don’t have customers in. Therefore, imputing a 100% penetration on this route doesn’t quite make sense, does it?
This is where all the confusion stems from and it stems from companies computing their penetration reports using the total number of customers a shop has in each route as compared to using the number of houses, they have a customer in.
If that sounds confusing, it’s because it is. To bring clarify you must understand that a carrier route counts the number of houses inside each route e.g. There are 10 houses in our example route, it does NOT count the number of people living in each house, which there is no way to ever know this number.
Again, a carrier route counts the number of houses inside each route NOT the number of people living in each house.
Therefore, you cannot look at and compare the total number of customers you have in a route to the number of houses in that route. When this is done, it skews the % penetration as illustrated in our example with a 100% penetration yet only 5 of the 10 houses have customers living there.
The correct way to run a penetration report is to take your customer list and remove any customers that live at the same address to only leave one customer per household. This will allow us to compare number of houses in each route to number of houses you have a customer in giving us an accurate household penetration. Accurate penetration report with multiple customers living at the same address removed providing an accurate picture of penetration which is 50% meaning there are still 50% of the houses in this route that you have not acquired a customer in and penetrated.

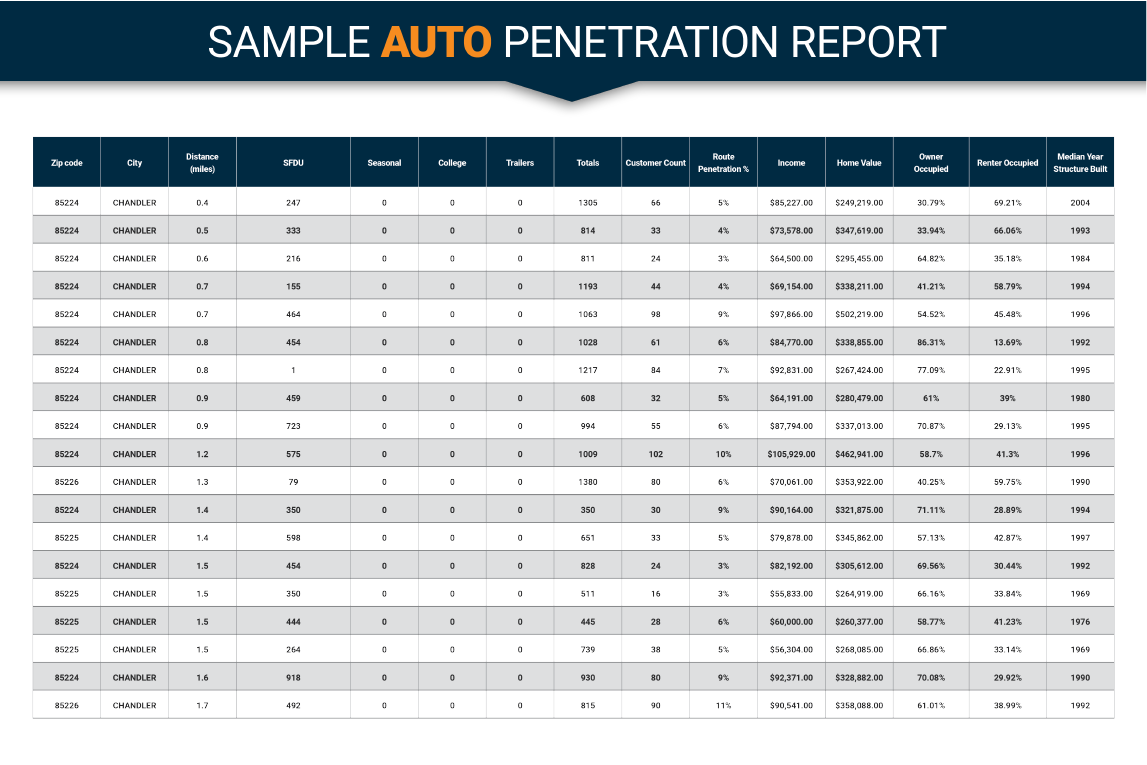
Here is what an actual penetration report looks below:
 Now I would like to be very clear about something. We are not saying that customer count doesn’t matter and is not important. What we are saying comparing customer count is not an accurate metric to compare to number of houses to get an accurate penetration. For all the reasons state above, this is why Mail Shark does the extra leg work to provide our client with both House Count and Customer Count.
In summation, how you want to analyze your shops customer data is entirely up to you. Feel to run the numbers and metrics how you best see fit that is entirely up to you. My goal was to merely bring transparency to the numbers.
Expert Tip:
One of the biggest issues with penetration reports is bad customer data out of your CRM. A penetration report can only analyze valid and standardized USPS addresses. Unfortunately, most shops have bad customer data that is either missing an address entirely or has an incorrect address that cannot be validated.
Bad records like this skew your penetration report data as they are not able to be included in your penetration report.
Ask you direct mail partner to provide you with a list of bad records so that you can have your service advisor or other team members work to correct this data. Not only will it help create a more accurate penetration report it will help with any customer retention direct mail service reminder cards you may be sending.
Contact one of our auto repair direct mail marketing experts to unlock the power of your data. for your complimentary penetration report analysis.
Josh Davis