

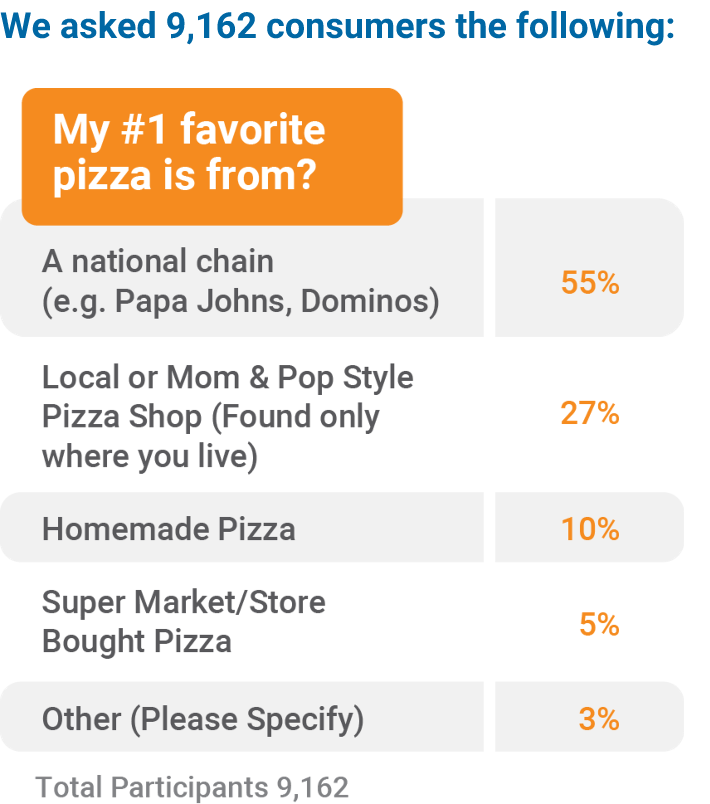

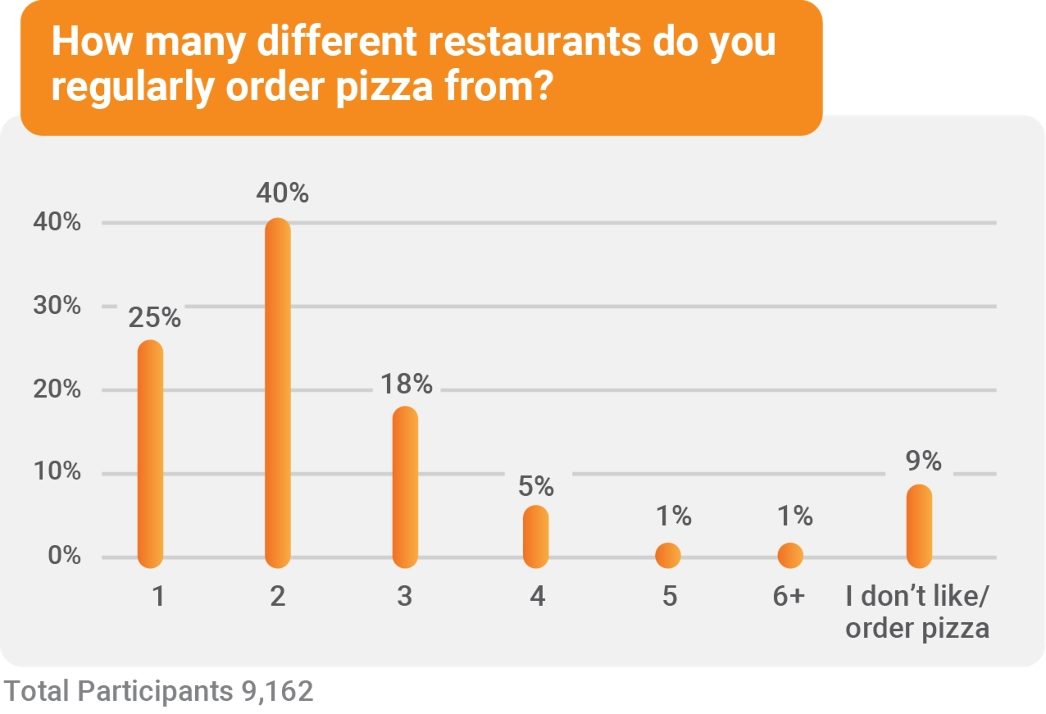
There is a regional component to these numbers. Only 14% of survey respondents in the state of California reported they prefer a local or mom-and-pop pizza shop. In the state of New Jersey, 59% of survey respondents reported they prefer a local or mom-and-pop pizza shop over a chain. Further, 65% of survey respondents reported that they regularly order pizza from two or more restaurants.
Their favorite pizza may be from a national chain, but that doesn’t mean they do not patronize mom-and-pop shops. We are left scratching our heads about the 9% of respondents who reported that they don’t like pizza/order pizza. We may need to double-check the data to see if they are from Mars…

Download Cracking The Code Pizza Industry To Learn More About Your Restaurant’s Customers,
Access Mail Shark’s Latest Consumer Research And Insights Report.


What Else You’ll Learn:
- How much does Covid still influence customers dining decisions?
- From where do consumers report their favorite pizza is from?
- How long do customers want to wait for their delivery orders?
- How often do your customers want to hear from you?
- What Google rating can hurt your business?
- How do customers prefer to place orders?
- Do consumers sign up for loyalty plans?
- Are customers still using coupons?
- & Much More!