

Pensacola A/C & Auto Service Center started its direct mail program in January 2024 with 5,000 postcards. Those postcards went out 500 at a time over 10 weeks, with 10 weekly payments of $250.
There wasn’t a massive upfront commitment or any way to know where the program would eventually go. They started at a manageable level, tracked what happened, and let the results determine what came next.
How We Know What the Mail Actually Produced
Before getting into the results, it’s worth explaining where the numbers come from.
Every performance number in this post comes from our ROAS dashboard, which integrates with Pensacola’s shop management software, Tekmetric. We use customer match-back data to connect mailed households with customers who later completed a repair order at the shop.
If a company tells you a campaign generated revenue but can’t explain how they connected a mailed household to a paying customer, you’re looking at an estimate wearing a suit.
The Results Didn’t Peak Early. They Built.
At the North location, ROAS progressed like this:
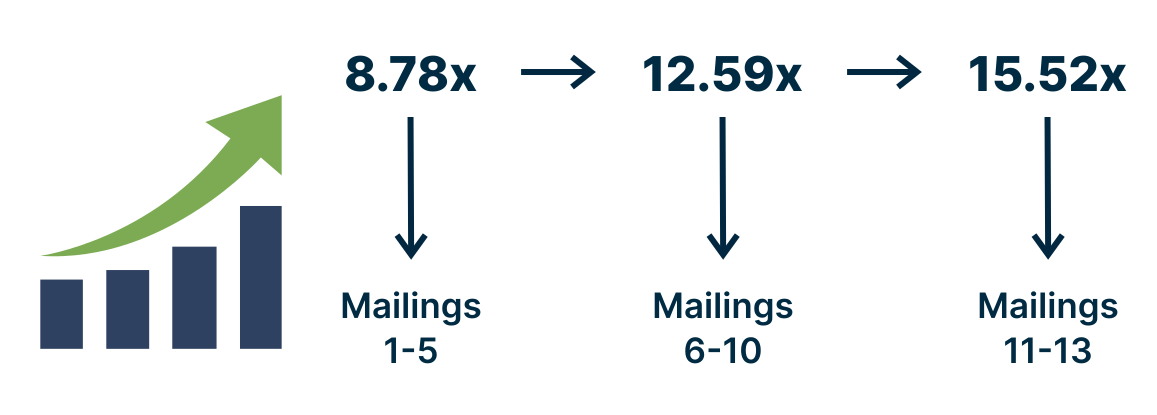
The strongest performance came later, after the program had been running for awhile.
I want to be careful about what I claim here. I can’t tell you frequency alone caused that improvement. The size of the program was changing at the same time, and results can be affected by the audience, creative, offers, timing and plenty of other factors. There are too many moving parts in a live marketing campaign for me to honestly point to one variable and give it all the credit.
What I can say is that this is exactly why I push back on judging direct mail based on one mailing.
One mailing gives you a data point. It usually doesn’t give you enough data to confidently judge the channel.
Why Repetition Matters in Auto Repair Direct Mail
Think about how auto repair demand actually works.
Someone gets your postcard on a Tuesday. Their car is running fine. They don’t need you, so the postcard may get pushed aside.
Three weeks later their brakes start grinding. A month after that the check engine light comes on. Six months later they need tires or another repair.
The need shows up on the customer’s schedule, not yours. That’s part of the strategy for a sustained program instead of a one-time mailing. Repeated exposure gives your shop more opportunities to be recognized when the customer actually needs something.
But frequency isn’t the whole equation. You still need enough reach, the right audience, creative that doesn’t look like everyone else’s, an offer worth acting on and a clear call to action.
Frequency without those things is just repeated failure.
If you want to dig deeper into that balance, we break down frequency vs. reach in direct mail.
Scaling on Evidence Instead of Hope
Once the results supported it, Pensacola expanded.
By the November 2025 through March 2026 campaign period, the North location had grown from its original 5,000-piece starting program to 27,106 pieces per mailing.
That’s more than five times the volume they started with.
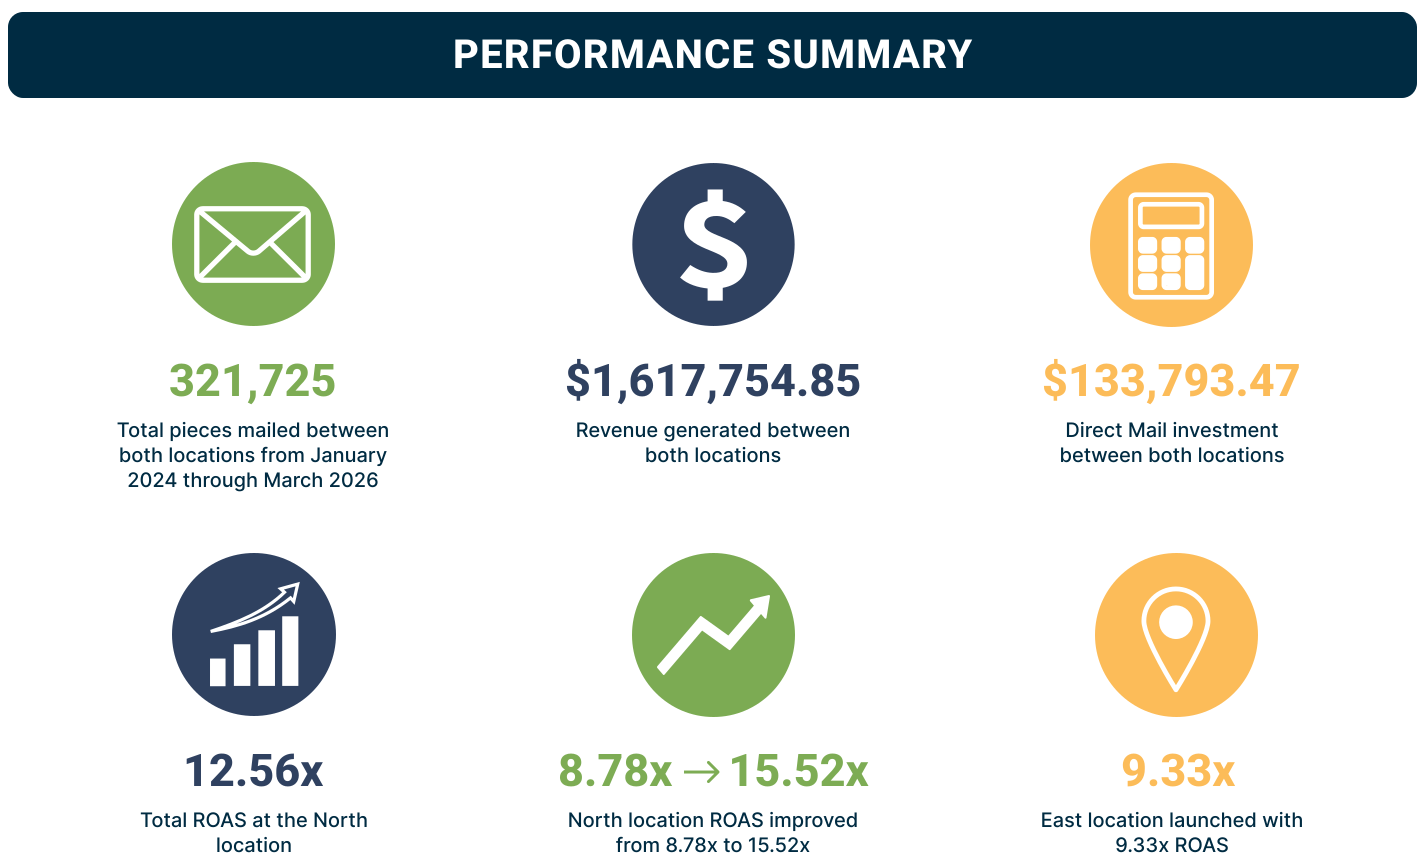
Then in January 2026, Pensacola added its East location to the direct mail program. Across its first two mailings, the East location generated a 9.33x ROAS.
I think that’s an important part of the story. It doesn’t prove that every location will perform the same way, and I wouldn’t claim that it does. But it gave Pensacola another strong early result from the direct mail strategy, this time at a second location.
Pensacola didn’t scale based on hope. They had real performance data from the North location, increased the size of that program, and eventually expanded direct mail to another location.
Where It Stands
From January 2024 through March 2026, Pensacola mailed 321,725 pieces across both locations on a combined direct mail investment of $133,793.47.
Tracked revenue came to $1,617,754.85.
Combined across both locations, that’s a 12.09x ROAS. Broken out, the North location generated a 12.56x total ROAS through the case study period, while the East location generated a 9.33x ROAS across its first two mailings.
The North location’s total ROAS is lower than the 15.52x generated by Mailings 11-13 because that total also includes the earlier mailing groups, which produced lower returns.
At the time this case study was prepared, Pensacola remained actively mailing.
None of this means a shop that starts at $250 a week will end up with the same results. Results depend on the market, the business, the audience, the offer, the creative and the execution. I’d be lying if I said otherwise.
To me, the lesson is simpler: scale when the data earns it.
Pensacola started with 5,000 pieces, built enough history to understand what the program was producing, and expanded as the numbers supported it. They didn’t have to guess whether direct mail deserved more budget because they were measuring it against actual customer revenue.
Want to see the complete numbers behind the program?
View the full Pensacola A/C & Auto Service Center Case Study